Workspaces
What is a Workspace?
A workspace is the term we use to describe an experiment configuration file (extension: .trodesconf). Workspaces store both hardware and software configuration information, basically telling Trodes what devices it is connected to, what data to expect from those devices, and how to format the incoming data. As such, workspaces are required for experiments to be run on Trodes. However, more than that, they also provide a way for those same experiments to be both easily replicated by other users and quickly reopened in a separate session by the original creator.
Creating a Workspace Configuration
To begin, open Trodes and click on the menu item labeled “Create Workspace.”
In the submenu that opens you have two options, “From Scratch” and “Edit Existing File.”
Selecting the “From Scratch” option will open the workspace editor menu of a blank workspace with a few defaults selected.
Selecting the “Edit Existing File” will open the workspace editor and populate it with a user-selected workspace’s configuration settings.
Tweak and edit all workspace settings as you see fit via the menu options. See the using the workspace editor section for information on what the different options in the editor menu do.
When you are finished editing, you can save the workspace on your computer to load later. You can also click the ‘open’ button to load the workspace immediately. If you made any mistakes or configured your workspace incorrectly, an error message will appear informing you what settings you need to correct.
Using the Workspace Editor
The Workspace Editor is a graphical user interface that provides a convenient way for users to create and edit Trodes configuration files without the hassle of having to mess with the underlying xml. Available in both a standalone module and embedded in Trodes, the Workspace Editor is a dialog menu made up of several tabs; a general settings tab, a auxiliary configuration tab, a trode configuration tab, and a module configuration tab.
General Settings Tab
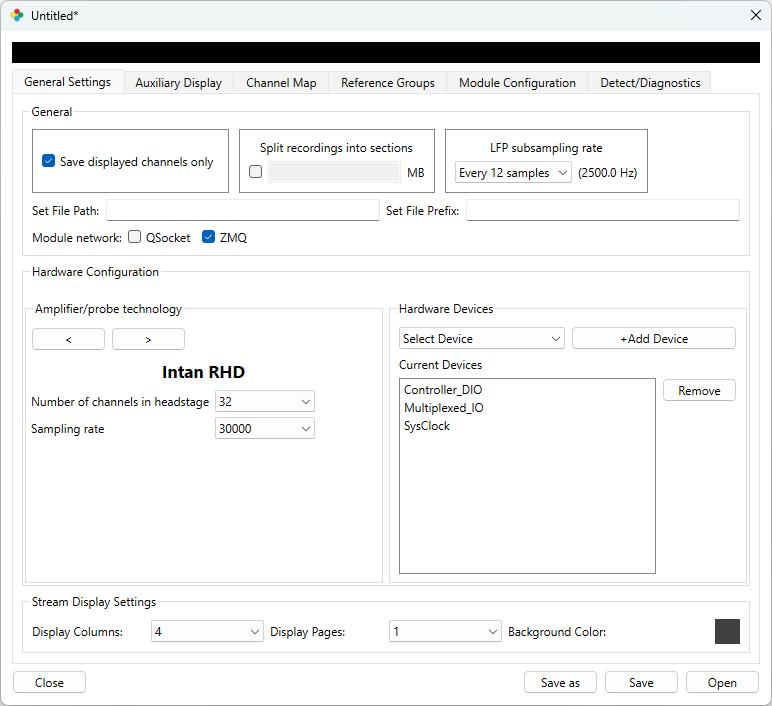
The General Settings tab allows the user to edit the General Workspace Configuration, the Hardware Configuration, and the Stream Display Settings. As such, each setting group is organized into different groupings.
Global Configuration Settings
Save Displayed Channel Only: Clickable check box that allows you to specify whether to save neural channel data for all channels or just those currently displayed/assigned to specific nTrodes.
Set File Path: Line editor that, when clicked, will prompt you to select a default save directory for .rec files.
Set File Prefix: Line editor that allows you to give saved .rec files a default prefix string. In other words, anything entered into this box will be added to the front of the default .rec file’s name.
Module network: This is the network protocol that is used for communication between modules. The legacy method is based on QSockets, and only supports built-in modules such as the Camera Module. The newer protocol is bsed on ZMQ and is required for real time scripting with python. See the API documentation.
Hardware Configuration Settings
Amplifier/probe Technology Trodes supports the following amplifier/probe configurations for acquiring neural data: - None: Zero-channel configuration containing only the environmental record. This configuration is used for all untethered data logging experiments regardless of headstage amplifier/probe type. - Intan RHD: Spikegadgets headstages built using Intan Technologies RHD chips such as the HH128, HH256, ML32, UH32, UH32stim & 32-channel Mini-Mouse Headstage. - Neuropixels 1.0 probes: Supports up to 3 standard Neuropixels probes. - Neuropixels 1.0 NRIC chips: Supports probes using the 384 channel Neuropixels 1.0 NRIC chip. - EChip 1.0:
Hardware Sampling Rate For amplifier/probe types that support multiple sampling rates such as systems built using the Intan RHD chip. 30 kHz is the default setting.
NOTE: 2 kHz sampling rate requires MCU firmware version 3.20.5 or later, and 2024 release headstage firmware.
The Hardware Configuration Group also contains the Current Devices Panel that can be used to add or remove devices to your workspace. To add a device, simply click the “Select Device” option, select the desired device from the drop down menu, then click the “+Add Device” button. The newly added device will be added to the list of “Current Devices.” To remove a device, select one of the devices from the “Current Devices” list and click the “Remove” button.
Currently, the devices you can add/remove from your workspace are:
Controller_DIO: The SpikeGadgets Main Control Unit has 6 digital input channels. This device can also be used for the Logger Dock DIO channels.
ECU: The SpikeGadgets Environmental Control Unit (ECU) has 32 configurable digital input channels, 32 configurable digital output channels, 8 configurable analog channels, and 8 configurable analog output channels.
Multiplexed_IO: SpikeGadgets headstage sensors. Has 3 xyz analog outputs for accelerometer, gyroscopic, and magnetometer data. Can also include the analog input channel of the Logger Dock.
SysClock: This appends the computer’s system date/time to each data packet.
Stream Display Settings
The Stream Display Group panel allows you to edit the basic settings for how Trodes displays the hardware channel traces (this is the main central display widget you see when loading a workspace).
Display Columns: Pull down menu that allows you to select how many columns you want the stream display to use when displaying nTrode channel traces.
Display Pages: Pull down menu that allows you to select how many tabs you would like the stream display to distribute configured nTrodes/channels across.
Background Color: Pressing the colored box will bring up a color picker menu that allows you to select what background color you would like to have for the stream display.
Auxiliary Display Tab
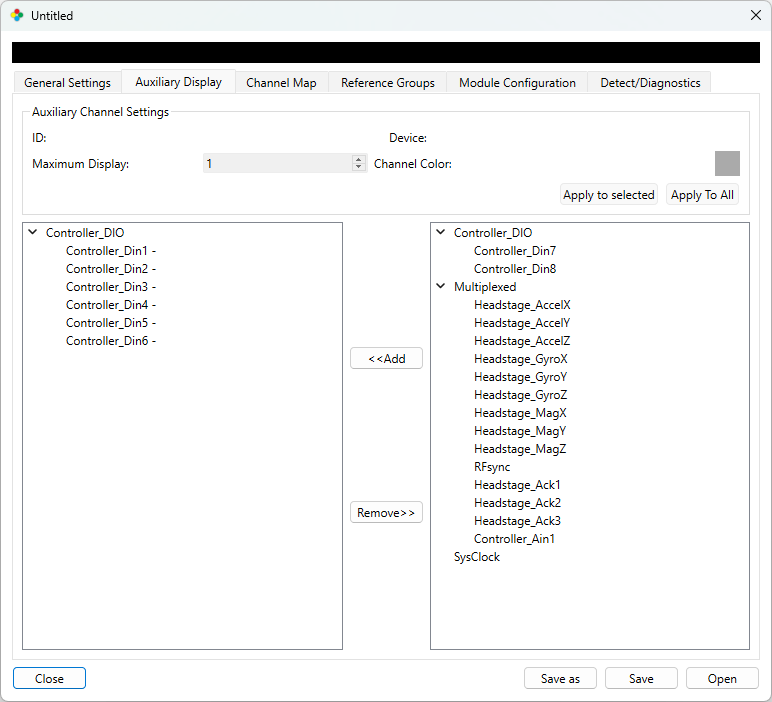
The Auxiliary Display Tab allows you to selectively add/remove/edit different available device hardware channels (referred to as ‘aux channels’) to your configuration from a list of available devices previously determined in the General Settings Tab. The Auxiliary Configuration Tab consists of two main sections; in the top half is a Auxiliary Channel Settings Group which allows you to edit individual aux channel settings, and the bottom half which features two list views, the left being a list of added/configured aux channels and the right a list of available channels to add.
To add an aux channel, select a channel from the right list, and simply click the “+Add” button. To edit the added channel’s settings, select the channel in the left list view. This will load the channels settings into the Auxiliary Channel Settings panel, allowing you to manipulate the fields as you see fit. There are also controls to modify the maximum display range of each channel and also the color.
All added aux channels are visible in the main Trodes program in the “Aux” tab in the main stream display.
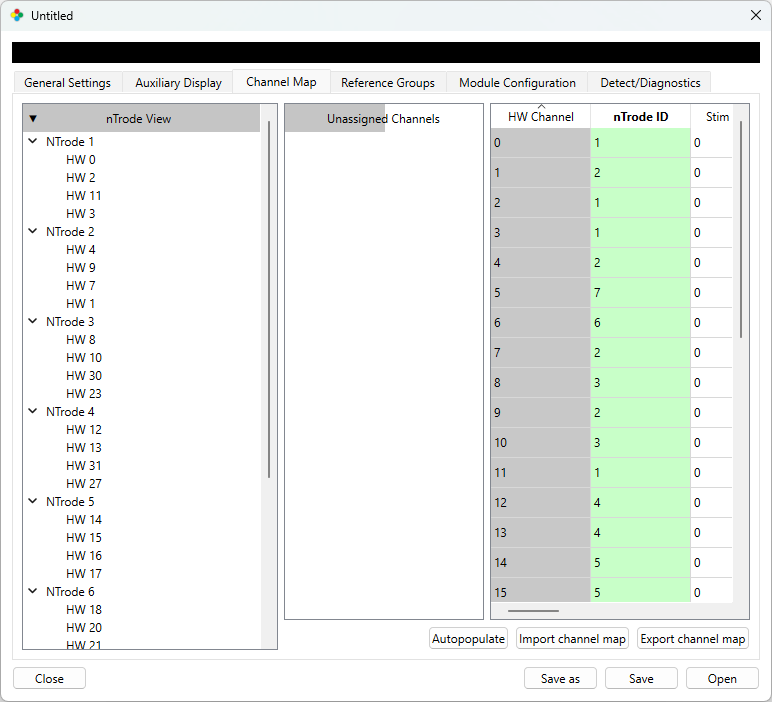
Channel Map Tab
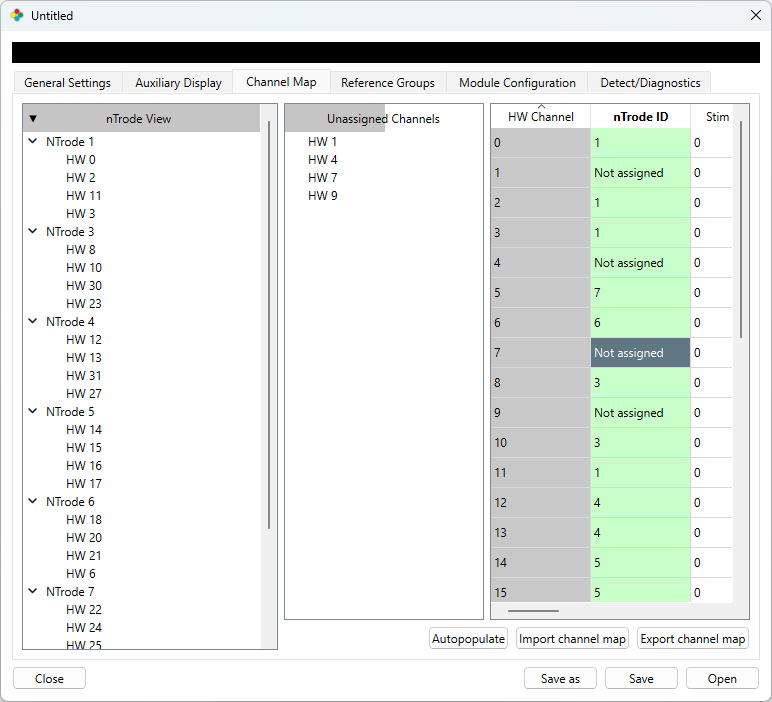
The Channel Map tab provides the controls to assign neural channels to nTrodes. It consists of three major sections; the nTrode View panel which provides a list-based view of which hardware channels are assigned to each nTrode, the Unassigned Channels panel which proves a list of all hardware channels that have not yet been assigned to an nTrode, and the editable Channel Table which is used to assign hardware channels to nTrodes by entering the nTrode ID next to each hardware channel. You can assign mapping directly in the table, and the other two panels will update automatically as you progress.
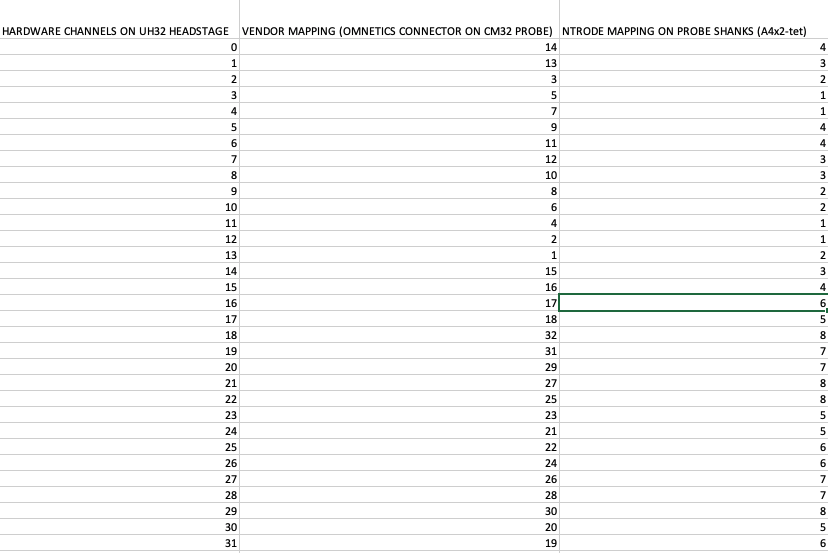
We recommend that you use a 3rd party spreadsheet program such as Microsoft Excel to help create your map. Each column in the spreadsheet should represent one map along the path from the headstage to the actual electrodes. The first (hardware channel) and last (nTrode grouping) columns of this map are the columns shown in the Channel Map tab, but there are generally more in between for each connector in the path between the hardware and the electrodes. Each row represents the patch from the headstage hardware, through all connectors, and to the electrode. Here is an example speadsheet for a probe sold by NeuroNexus (A4x2-tet probes with a CM32 package):
Once you have completed your map, you can copy the last column onto your clipboard and paste into the Channel Map tab. You can also save a .csv file containing just the first and last columns and import using the “Import channel map” button. In the .csv file, each row should consist of two numbers separated by a space and ending with a newline character. If your electrodes are not bundled into groups such a tetrodes, then you should assign a unique nTrode ID to each hardware channel. We recommend limiting your nTrode sizes to a maximum of 16 channels per nTrode for performance. In Trodes, the nTrodes will be displayed in order starting with nTrode 1. After copying the last column of the above example into the workspace editor, the Channel Map tab looks like this:
Now, let’s say that tetrode 2 on the probe is broken and noisy and you would rather not display it, then you can unassign those channels by clicking on each channel in the table and pressing the delete/backspace button. The map will then look like this:
The settings for each nTrode (filters, referencing, color, etc.) are set to default values at first and can by modified once the workspace has been loaded.
There are some additional columns where optional data can be entered for each channel:
Stim Capable: This must be set to “1” for channels that are capable of switching to stimulation mode. Note: any channel that is set to Stim Capable can’t be used as a digital reference.
AP, ML, DV Coordinates: Used to enter to brain coordinates of each channel. This information is required by some automated spike sorters.
Sorting Group: Used to designate sorting groups not defined by the basic nTrode structure. These groups are used by the trodesexport utilities when creating files for either Kilosort or Mountainsort.
Display Order: The order that the channels are displayed within the nTrode.
Reference Groups Tab
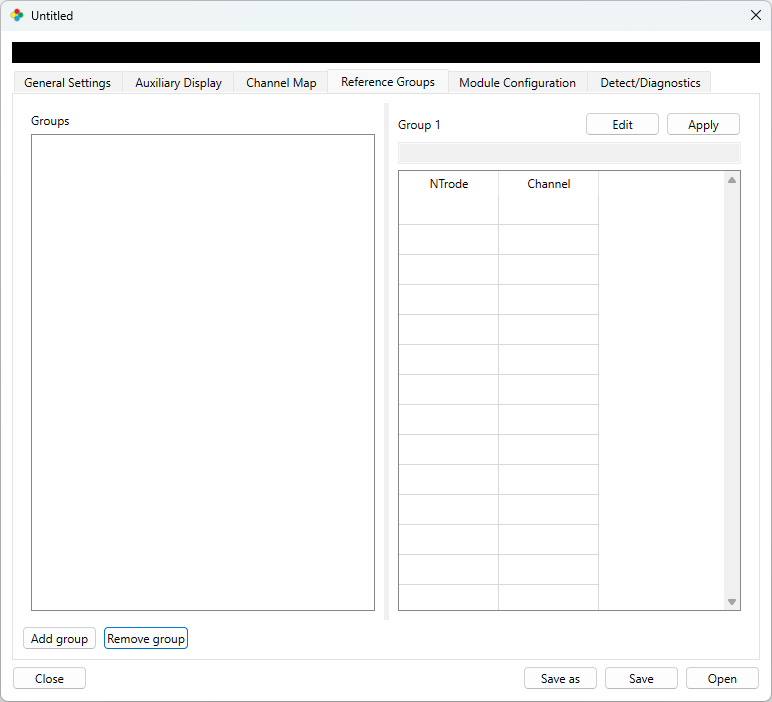
This tab is used to create reference groups, or groups of channels that are averaged together and used as a single digital reference. Each channel in the group is identified by the trode and channel within that nTrode.
Module Configuration Tab
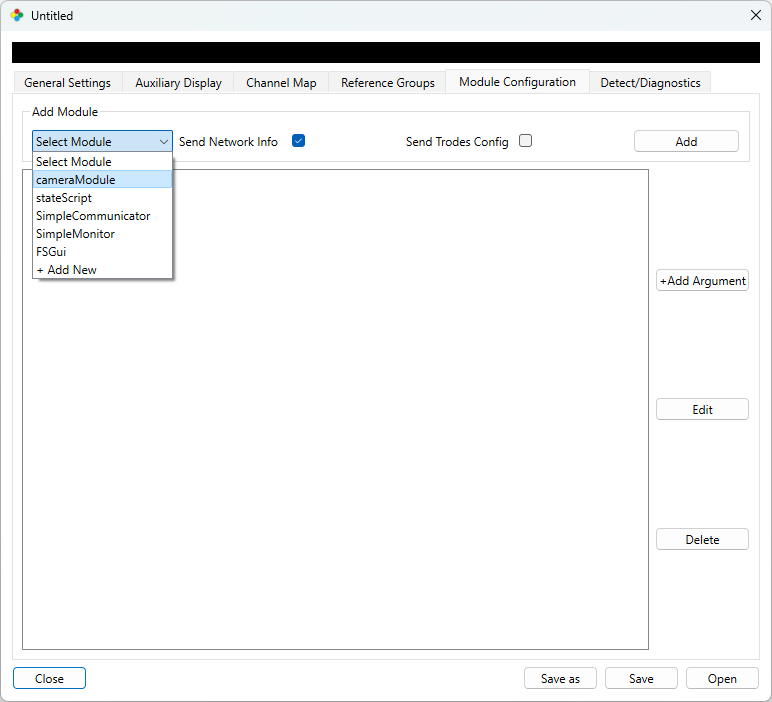
The Module Configuration Tab provides an interface with which to add modules to your workspace. The panel consists of two sections, the Add Module Panel and the Module List. The Add Module Panel is used to add or edit modules while the Module List displays added modules and their settings.
To add a module, select the drop down list labeled “Select Module” and select the module that you want to add. More information about the modules that come prepackaged with Trodes can be found here, however, if you want to add a different, non-standard module (for example, one you created yourself), you can add by selected the “+Add New” option. Simply type in the name of your module’s executable (on windows and linux) or app bundle (on mac), and click add.
You can add command line arguments to a module by selecting it in the list view and clicking the “+Add Argument” button. Add in the desired command line flag and value in the prompted dialog.
To edit/remove a module or a module argument, click the module or module argument in the list view and click either the “Edit” or “Delete” button. When you click the “Edit” button on a module, the Add Module Panel loads the module’s settings and allows you to edit them. Make sure to click “Apply” when you are ready to save your changes. Likewise, clicking the “Edit” button on an argument will bring up the argument dialog, allowing you to change the argument’s flag and value.
Add Module Panel
Select Module: Drop down menu that allows you to select a pre-defined module, or add a user defined one.
Send Network Info: Checkbox that tells Trodes whether or not to send the Trodes network server to the module on startup. This is enabled by default.
Send Trodes Config: Checkbox that tells Trodes whether or not to send the configuration file path to the module on startup. This is enabled by default.
Add/Apply Button: Button that either adds a module to the module list or applies changes to an existing module’s settings.
Detect/Diagnostics Tab
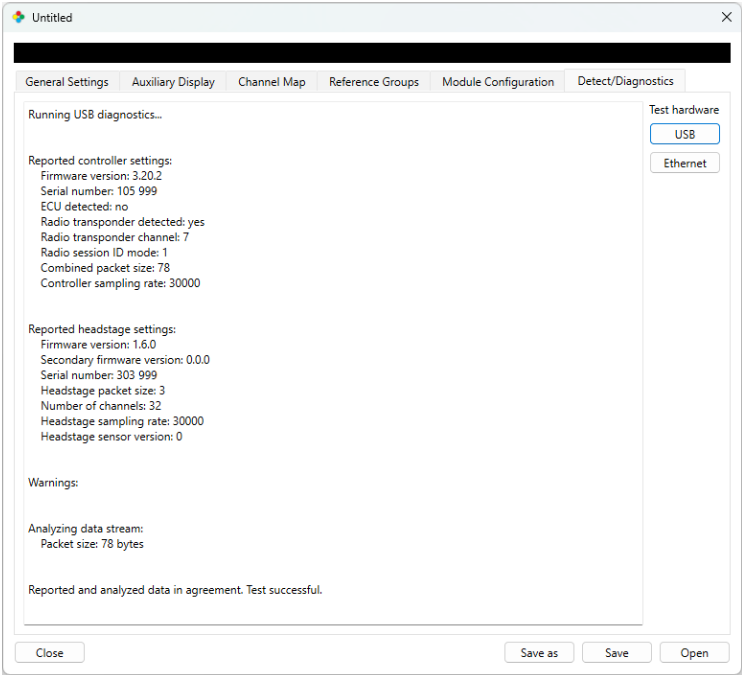
This tab is used to run basic diagnostics on the connected hardware. With the hardware connected, you can either click the USB or the Ethernet button to initiate a report. The example above shows the MCU connected to a Stimulation HCU with one 32-channel stimulation headstage mounted.
This test can also be run using the Connected Hardware Report in the Trodes Main menu.